healthpod
Health Pod — Your Health Data in your Data Vault









A solidui based app to support the secure and private storage and AI analysis of your health data with data encrypted and stored on your own personal online data store (Pod) hosted in your Data Vault on a Solid Server. The app was developed by the ANU Software Innovation Institute and written by Ashley Tang, Graham Williams, Zheyuan Xu, Kevin Wang, and Tony Chen.
If you appreciate the app then please show some ❤️ and star the GitHub Repository to support the project. You can install the app from different repositories including SnapCraft for Linux.
The latest version of the app can be run online at healthpod.solidcommunity.au with no installation required, or downloaded and installed for your platform from the Solid Community AU:
Contributions are welcome. Visit github to submit an issue or, even better, fork the repository yourself, update the code, and submit a Pull Request. The app is implemented in Flutter using solidpod for Flutter to manage the Solid Pod interactions. Thank you.
Introduction
The Health Pod collects into one private and secure location all of your health data and medical records. Value is added to the data through various provided tools, including privacy preserving large language models. You collect your health data together and then you can interact with it to review your health. You can also decide if you want to share that data with anyone else, like you general practitioner for them to provide their professional advice.
For a quick start, first download the sample blood pressure CSV
file. Then
within the app navigate to the FILES tab, navigate to the BLOOD
PRESSURE folder, tap the IMPORT CSV button, navigate to and choose the
downloaded sample_blood_pressure.csv. After the import has
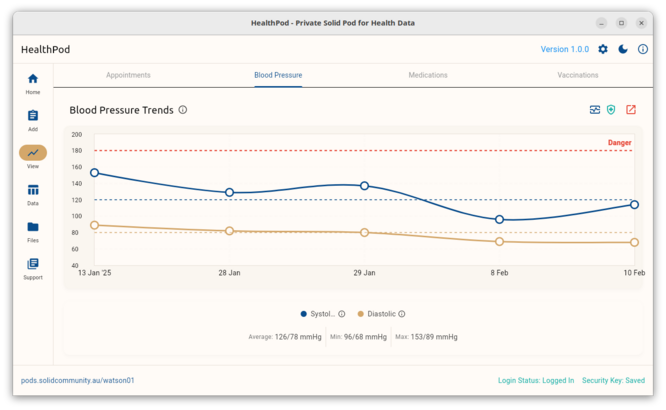
completed, navigate to the VIEW tab and select the BLOOD PRESSURE
option:
Comparing with others
The Analyse button in the top right of the blood pressure chart shares your readings with the Analyser Pod, a service that works out your own averages and the averages across everyone who has contributed, and returns a chart of your readings with both marked on it. The Analyser is granted read access to those readings and nothing else, no other participant ever sees your individual readings, and you can withdraw the access at any time from the file browser.
Pressing the button shares the readings and then asks the Analyser to work,
over gRPC, and the answer comes back on the same call: the analysis begins the
moment you ask for it rather than when the service next looks, and cancelling
one stops it within a second or two. The service behind it is a Python program
living in analyser/bp_analyser, which documents how
to deploy and operate it.
Milestones
- Basic Icon-Based GUI with Solid Pod login
- Profile management with personalized profile photo upload
- File browse my medical reports
- Daily entry of Blood Pressure with visualisations
- Your latest clinic data + appointments and medicines
- Important medical information, notes and numbers
- My vaccination history
Design Goals
The app will work well on a desktop, web browser, a mobile phone or tablet.
A grid of icons provides access to the functionality.
The grid items include:
-
Obs (A feature to record daily or regular observations like blood pressure, physical activity, etc)
-
Activity (A record of activities recording date, start, end, what)
-
Diary (A record of visits to doctors, dentists, pharmacy, vaccinations, etc. Each diary entry records: date, what, details, provider, professional, total, covered, cost)
-
Docs (A file browser type of thing where the user can arrange their PDFs into appropriate folders as they like.)
Use Cases
-
I am visiting the doctor and I need to check when I last had a vaccination
-
A LLM model runs over the whole contents of the Pod to then allow me to interact with the data collection.
Time-stamp: <Saturday 2026-06-13 10:29:12 +1000 Graham Williams>